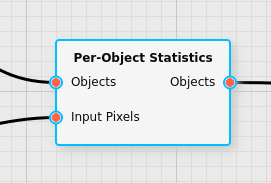
Per-Object Statistics Filter Reference
The per-object statistics filter calculates a full set of statistical quantities (mean, standard deviation, minimum, maximum, positions of extrema) for a given object and stores them in various columns of the object.
Category |
|
Node |
|
Parameters |
None |
Inputs |
Objects: a list of objects as generated from a object detection filter Input Pixels: pixel-based input for which the statistics are to be generated |
Outputs |
Objects: the list of objects augmented by columns that contain the statistical quantities |
Effect of the Filter
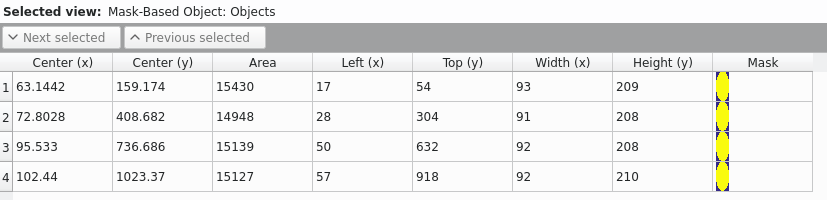
The Objects input of the Per-Object Statistics filter must be table data that was generated by an object detector filter. The table must contain columns that provide both bounding box information and a mask describing which pixels in the image belong to the object.
The following screenshot shows how such an object list may look like:
The Input Pixels input must contain cube data that is indexed by y, x, and channel dimensions. This may be HSI data (y, x, and wavelengths), but other types are also possible, such as the result of a per-pixel algorithm.
The following screenshot shows how such channel data may look like:
During execution the filter will look at each object provided in the Objects input and determine which pixels of the Input Pixels input belong to that object. It will add the data for all pixels belonging to the object to the statistics, and then calculate the statistical quantities (average, standard deviation, extrema) for each object.
The output will be a table of objects that will contain all objects of the input (with all of the information from the input), plus additional columns that contain the statistical properties of each object with respect to the provided second input.
The following screenshot shows the columns added by the filter using the example of the previous inputs:
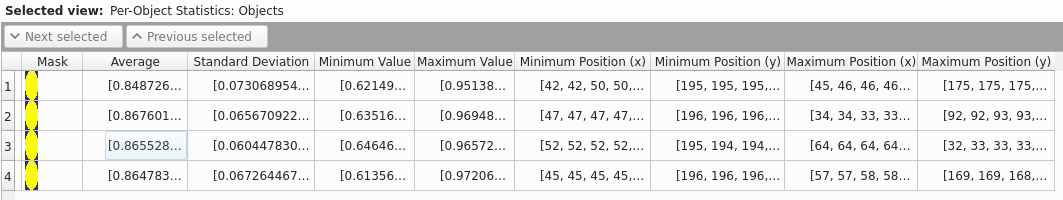
The structure of the statistical quantities will follow the structure
of the second input. In this example the second input consisted of HSI
data that was organized in (y, x, λ), hence the quantities were
calculated for each wavelength λ individually and the new columns
contain a one-dimensional array with the same number of entries as
there are wavelengths in the input data.
The positions of the minima/maxima obtained by this filter are always taken relative to the bounding box of the object. If the same object (with the exact same size, shape, and pixel values) is found twice at different positions, it will have exactly the same statistics data generated from this filter.
It is also possible to provides input data with only a single channel of data to the Input Pixels input, for example such as in the following screenshot (where the data of the previous example is simply averaged over all wavelengths):
In that case the statistics values will also be only a single value (instead of an array), so that the result could look like this, following the example:
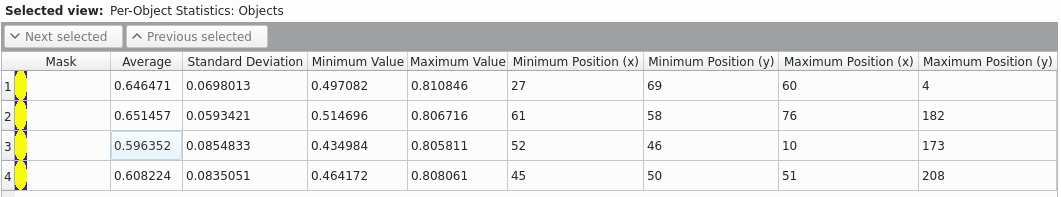
Illustration with artificial data
To illustrate the effect of the filter more clearly the following example will show artifical data. Consider a single value per pixel in the following artifical image:

The outline of an object as well as its bounding box are marked in the image. The marked object would have the following properties:
Bounding Box Offset X: 2
Bounding Box Offset Y: 1
Bounding Box Width: 4
Bounding Box Height: 3
Area: 9
Center of Gravity X: 3.333…
Center of Gravity Y: 1.888…
Mask:
After applying the filter this would lead to the following statistical quantities given the input pixels shown in the illustration:
Average: 3.8666…
Standard Deviation: 1.3982…
Minimum: 2.2
Minimum X: 0
Minimum Y: 1
Maximum: 6.1
Maximum X: 2
Maximum Y: 2